

- Description
- Tutorial Video
- Request Trial
Description
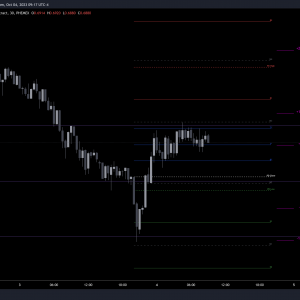
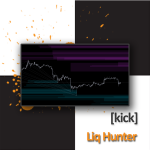
We are excited to introduce our newest indicator, Liq Hunter – an estimated liquidation zone visualizer.
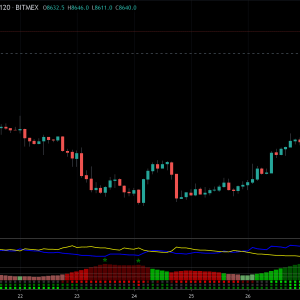
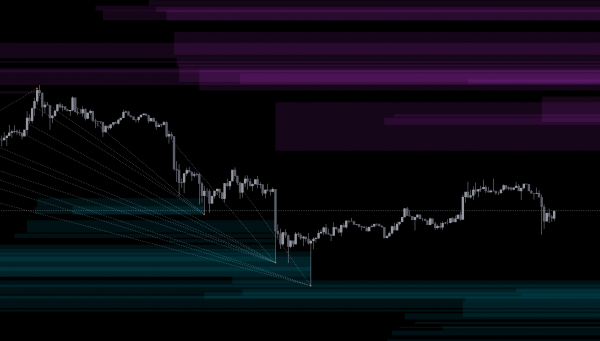
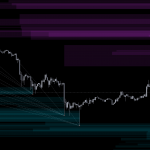
This indicator displays probable liquidation zones based on the analysis of high volume candles as defined per PVSRA which market makers use to move markets quickly often creating fair value gaps and trapping traders. These liquidation zones form areas of liquidity that are often become the hunting grounds of market makers (and now you!) before reversing price.
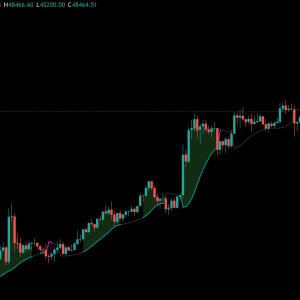
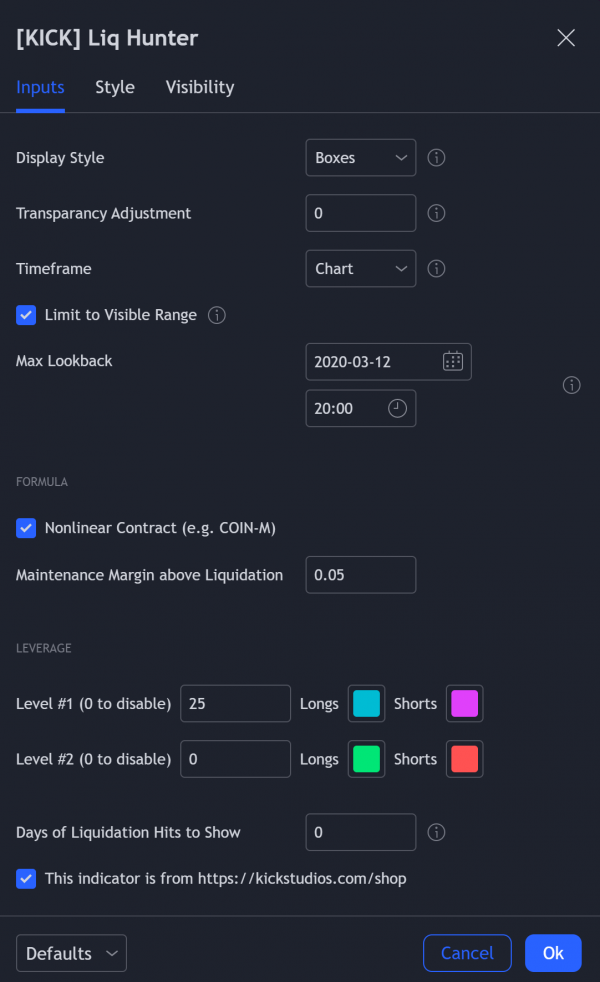
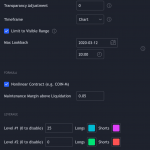
By default it will automatically update based on the visible range as you scroll and/or zoom – this keeps it highly performant as we only look at the candles on the screen. Sometimes it’s preferable to anchor the starting point back further than it is usable to display on the screen, so you can do that as well- just be aware that you may run into performance issues, or problems with the maximum number of boxes/lines allowed by TradingView (500) — if this is the case, just switch to a higher timeframe or move the anchor point closer to current price action.
There are also options for what leverage ones to show (up to 2, by default we only have one enabled 25x). As you are looking at longer timeframes you may want to seek lower leverage position holders and vice versa if on lower timeframes (e.g. 50x on 5m). 25x seems to work well for 15m-1H, maybe even up to 4H.
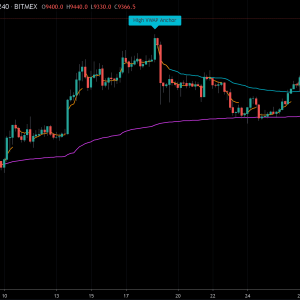
Optionally you can also have it show you all the PVSRA candles that had their liquidation zones “hit” by particular candles. This is off by default, but it can be interesting to see how methodical and precise market makers are in their liquidity (and specifically liquidation) hunts.
Be sure to check out all the tooltips in the indicators settings for more information about customizing the indicators functionality.
While there are many ways you can use this indicator from a trading perspective, we have been very successful in determining target profit zones to exit our trades as often the price will go right to the edge of a liquidation zone before reversing. The visualization also gives you a feel for the density of liquidations for short and longs above and below the price helping you gauge which direction the market makers are more likely to send price action. This is especially exploitable in consolidation patterns such as triangles where traders get trapped on both sides of the shrinking zone. The direction that holds the highest volume of potentially trapped traders is generally the direction of the ultimate breakout.
To request a FREE 7 DAY trial click the button below. This will add a special “trial request product” to your cart and take you to checkout. As long as your cart only has free items in it you will not have to enter any payment methods. Do make sure you enter your correct email address and TradingView username as this is how we will provide you with trial access to the indicator and notify you. Please note that it may take up to 12 hours to process your trial request. Lastly, if you would like to request multiple trials in the same “order” that is completely fine – add them from each indicator page until they are all in your cart and then complete the checkout process.