- Description
- Tutorial Video
- Request Trial
Description
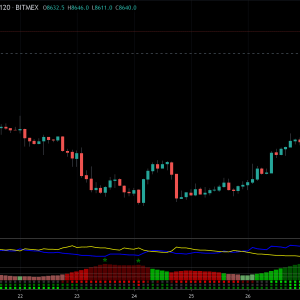
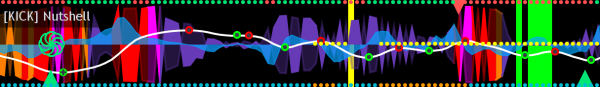
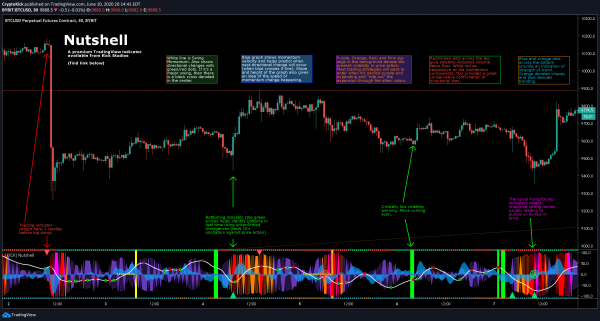
Our newest indicator gives you a true read of the market at quick glance – “in a nutshell”. The indicator contains components for volatility, momentum, trend strength, volume flow, price divergence detection, and impulsive move detection. The specific components of the indicator are:
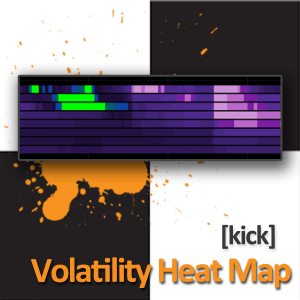
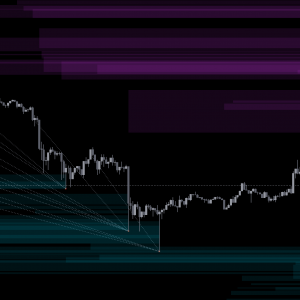
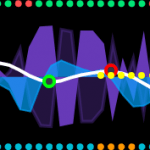
- Price action volatility indicator (the background zig-zags that are purple, orange, red, and pink). We are using a percentile ranking of ATR which gives a broader picture of the price volatility intra-bar than something like historical volatility percentile because it encompasses the range of price action and not simply the close of each bar. It is typically best to enter trades in the purple zone and “ride them out” through the higher volatility intervals.
- Low volatility warning indicator (the bright green background highlights). When the ATR-PR is critically low, that means price volatility can only go on way (expand). These warnings are key to volatility strategies where knowing large moves are imminent is critical. While these warnings do not indicate the direction of the imminent move, there are plenty of other directional indicators present.
- Gravity Tunnel Squeeze indicator (the yellow dots down the center-line, culminating in a yellow background highlight upon release). This is a slightly different take on the Momentum Squeeze indicator. In the traditional implementation a squeeze occurs when Keltner Channels move inside Bollinger Bands. In our implementation we use the Center of Gravity as a basis and measure when the Z-Score Deviation moves inside an ATR multiple. At the point of release you typically see an expansion of volatility, though often the signal presents earlier than an ATR-PR expansion. The longer the price action was under the squeeze the longer/farther the released price action is likely to go.
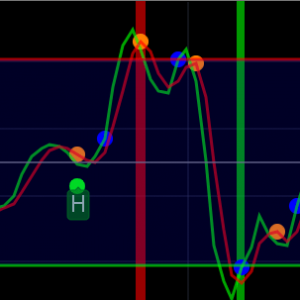
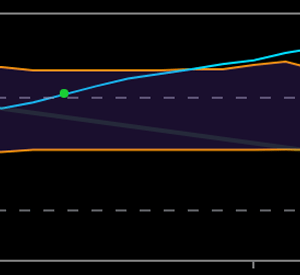
- Swing Momentum indicator (white line with various red/green dots on it). The swing momentum indicator uses stochastic oscillators in the style of the ever-popular “Wave Trend” indicator to give a responsive read on the price action momentum. Green and Red dots indicate a change in direction of the momentum and when these occur in the extreme the center of the dot will be a black cross. Usually these extreme direction changes denote larger trend changes.
- Momentum velocity indicator (blue area fill). This indicator can be used with the swing momentum line to determine how close/far the next direction change is away (every time the blue line crosses the zero-line a direction change occurs). The steeper the slope of this line also gives an indication of how fast the swing momentum is accelerating or decelerating.
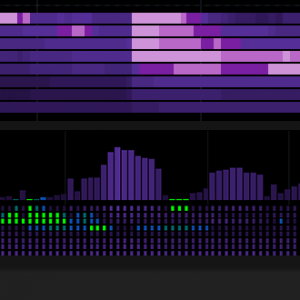
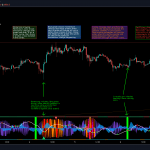
- Volatility Adjusted Volume Waves (the red/green dots across the top of the indicator) denote the current direction of price action based on cumulative volume weighted based on the ATR of the associated price action. While they are slower to respond than some of the other directional momentum components of this indicator, they can be treated as a pretty strong (conservative) confirmation of trend direction.
- Strength of Trend (the blue/orange dots across the bottom of the indicator) is indicated with a Leaf-West variant of the ADX. Basically, if you see orange the price action is considered choppy and if it’s blue it’s trending. Depending on your time frame you can interpret these a bit differently. On smaller time frames you might consider the orange areas no-trade zones and wait until it turns blue.
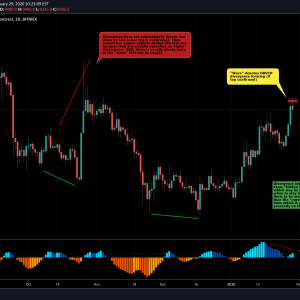
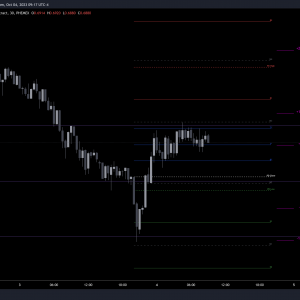
- Topping or Bottoming moves (Red triangles at the top or Green triangles at the bottom). We use a series of methods to detect likely reversal points (including checks for 10+ oscillator/price divergences). Since divergence is only confirmed after new local price highs/lows are established these reversal points won’t always be accurate, but we want to provide the earliest warning possible. Keep this in mind when taking action on them and wait a few bars for confirmation to be more conservative.
- Pump and Dump warnings (red/green spirals that appear in the center of the indicator). Using 3rd generation moving average stochastics we get a very sensitive read on when they form patterns that typically precede large price action movements. These patterns work better for some markets than others so you will have to test with your instrument and timeframe to see how accurate they are for you. If you get one of these in conjunction with a red/green triangle and/or just after a low volatility or GT-Sqz release highlight, then buckle up.
The indicator also includes a number of custom alert conditions (all related to the above indicator components) that can be used to create alerts.
You may request a 7 day trial of this indicator by clicking on the “Request Trial” tab/link above. An advanced tutorial video will also be available soon.
Tutorial Part 2

To request a trial click the button below. This will add a special “trial request product” to your cart and take you to checkout. As long as your cart only has free items in it you will not have to enter any payment methods. Do make sure you enter your correct email address and TradingView username as this is how we will provide you with trial access to the indicator and notify you. Please note that it may take up to 12 hours to process your trial request. Lastly, if you would like to request multiple trials in the same “order” that is completely fine – add them from each indicator page until they are all in your cart and then complete the checkout process.