- Description
- Tutorial Video
- Request Trial
Description
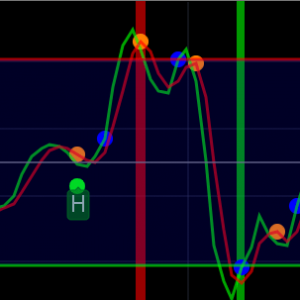
This indicator is a version of the ADX and DMI indicators optimized for maximum information conveyance related to trending price action in a compact space.
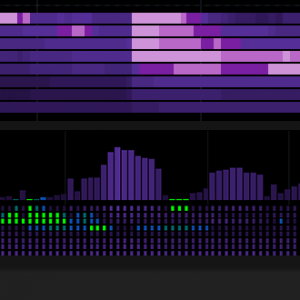
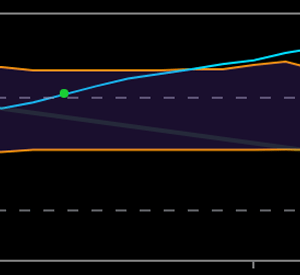
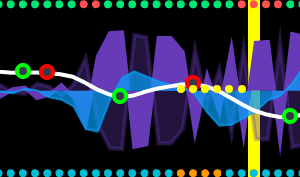
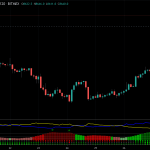
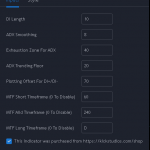
- Use the ADX barchart to determine strength of trend. There are various configurable thresholds for this measurement as well as peak marking within the exhaustion zone. The higher the values in the bar chart, the stronger the trend. Low values indicate non-trending or choppy price action.
- Use the DMI line graphs (as well as the color codes on the ADX barchart) to determine trending direction. You can offset the DI+ and DI- lines so that they are not directly on top of the ADX chart. When the DI+ is on top (blue line by default) the trend is up and when the DI- line (yellow by default) is on top the trend is down. The colors of the ADX chart also indicate direction with red indicating down and green indicating up. The “pale” shades indicate a nacent/immature trend, “bright” shades indicate a solid trend, and the “darker” shades indicate a strong trend that is mature. Look for these mature trends to “top out” and have their peaks marked when the trend has exhausted itself.
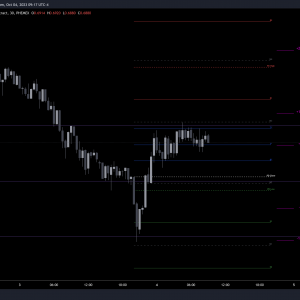
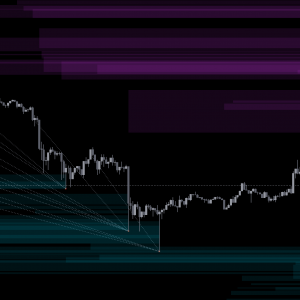
- You can specify up to 3 additional timeframes to monitor in the dot map below the ADX chart that will give you a generalized idea of the trend on those larger timeframes. In these heat maps, the color red indicates a down trend and green an up trend. The brighter colors denote strong trends while the darker colors are weaker. Grey dots in the heat map indicate no strong trend present. Some users actually prefer to turn off the main ADX and DMI visualizations and only display the multi-timeframe heatmap as a way of checking higher timeframe trends before entering their trades.You can specify up to 3 additional timeframes to monitor in the dot map below the ADX chart that will give you a generalized idea of the trend on those larger timeframes.
You may request a 7 day trial of this indicator by clicking on the “Request Trial” tab/link above. There is also a free 30 minute tutorial video you can watch to get a better idea of how to configure and use the indicator!
To request a trial click the button below. This will add a special “trial request product” to your cart and take you to checkout. As long as your cart only has free items in it you will not have to enter any payment methods. Do make sure you enter your correct email address and TradingView username as this is how we will provide you with trial access to the indicator and notify you. Please note that it may take up to 12 hours to process your trial request. Lastly, if you would like to request multiple trials in the same “order” that is completely fine – add them from each indicator page until they are all in your cart and then complete the checkout process.