Range Ruler
TradingView Premium Indicator
- Central Pivot Range and Floor Pivots (1-4)
- Tomorrow’s Estimated CPR and Daily Pivots Levels
- Monthly CPR and Pivots
- M-Levels
- Previous Day Close, High, and Low
- Daily Historical Volatility Normal Distribution Standard Deviation Levels
- Daily Average True Range Multiples Levels
- Request a trial for this indicator
- View a video of this indicator and suggested usages
- Purchase this indicator now!

Liq Hunter
TradingView Premium Indicator
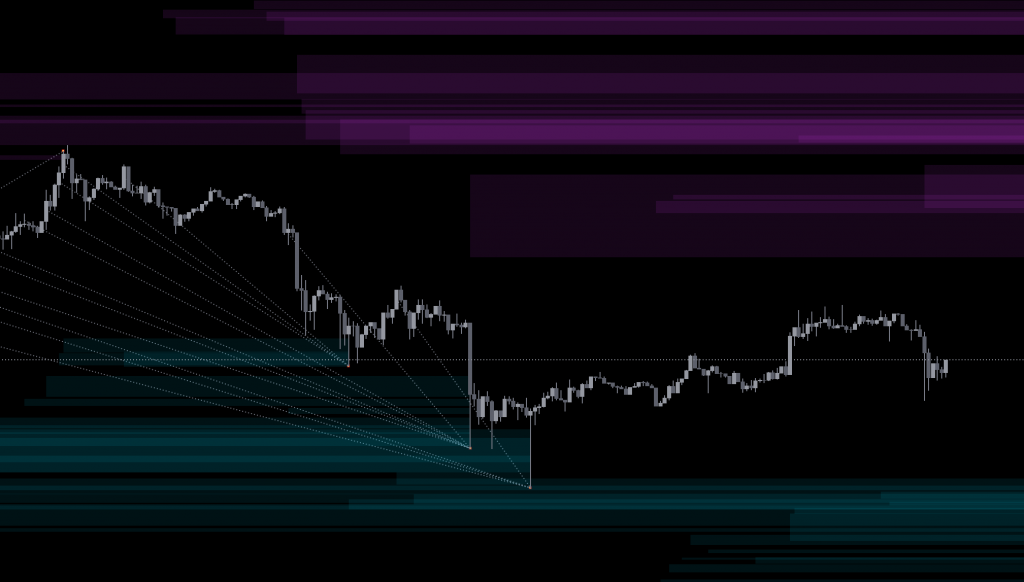
This indicator displays probable liquidation zones based on the analysis of high volume candles as defined per PVSRA which market makers use to move markets quickly often creating fair value gaps and trapping traders. These liquidation zones form areas of liquidity that are often become the hunting grounds of market makers (and now you!) before reversing price.
While there are many ways you can use this indicator from a trading perspective, we have been very successful in determining target profit zones to exit our trades as often the price will go right to the edge of a liquidation zone before reversing. The visualization also gives you a feel for the density of liquidations for short and longs above and below the price helping you gauge which direction the market makers are more likely to send price action. This is especially exploitable in consolidation patterns such as triangles where traders get trapped on both sides of the shrinking zone. The direction that holds the highest volume of potentially trapped traders is generally the direction of the ultimate breakout.
- Can render simple lines or translucent boxes for the zones
- Configure 1 or 2 different leverage settings to target
- By default auto-updates the zones based on the visible range of candles. See different areas and zones by simply zooming and panning your chart!
- Can also use an anchored point in time to produce zones from
- PVSRA volume candles determination and thus the liquidation zones can use any time frame, though it defaults to the chart’s timeframe
- Optionally you can render liquidation zone “hits” by tying candles that fill through the zone back to the original candle that trapped the traders
- Request a trial for this indicator
- View a video of this indicator and suggested usages
- Purchase this indicator now!
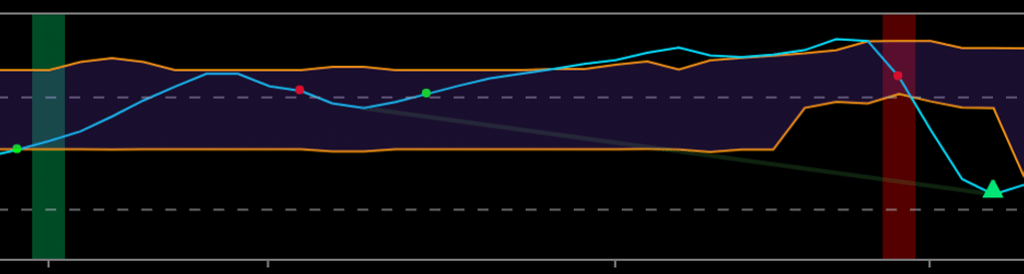
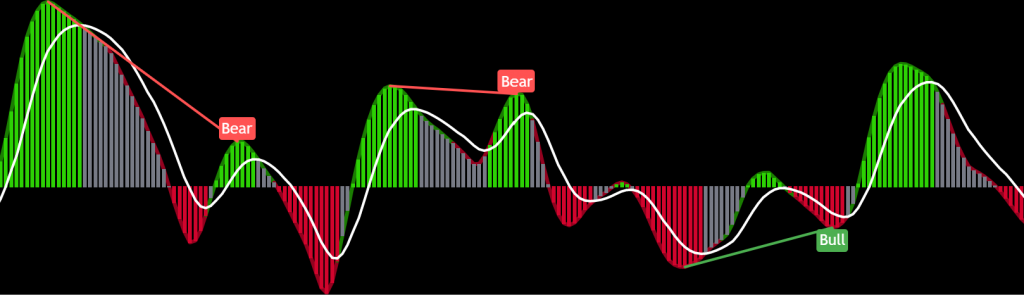
Dynamic Strength Index (DSI)
TradingView Premium Indicator
- Dynamic Strength channel is automatically calculated based a cyclical formula that is rooted in multiple mathematical models by John Ehlers
- Signals for dynamic oversold and overbought channel re-entries
- Signals for momentum crossings with optional display of the signal line as well
- Normal and Hidden divergence detection and display
- Request a trial for this indicator
- View a video of this indicator and suggested usages [coming soon]
- Purchase this indicator now!

Nutshell
TradingView Premium Indicator
- Price action volatility indicator (uses ATR-PR)
- Low volatility warning indicator (uses ATR-PR)
- Gravity Tunnel Squeeze indicator (uses Z-Score and ATR of CoG)
- Swing Momentum indicator (uses stochastics in the style of WaveTrend)
- Momentum velocity indicator (also custom WaveTrend)
- Volatility Adjusted Volume Waves (ATR-Weighted Volume Cycles)
- Strength of Trend (Leaf-West ADX)
- Topping or Bottoming moves (10+ oscillator divergence tests)
- Pump and Dump warnings (proprietary formula)
- The indicator also includes a number of custom alert conditions (all related to the above indicator components) that can be used to create alerts.
- Request a trial for this indicator
- View a video of this indicator and suggested usages
- Purchase this indicator now!
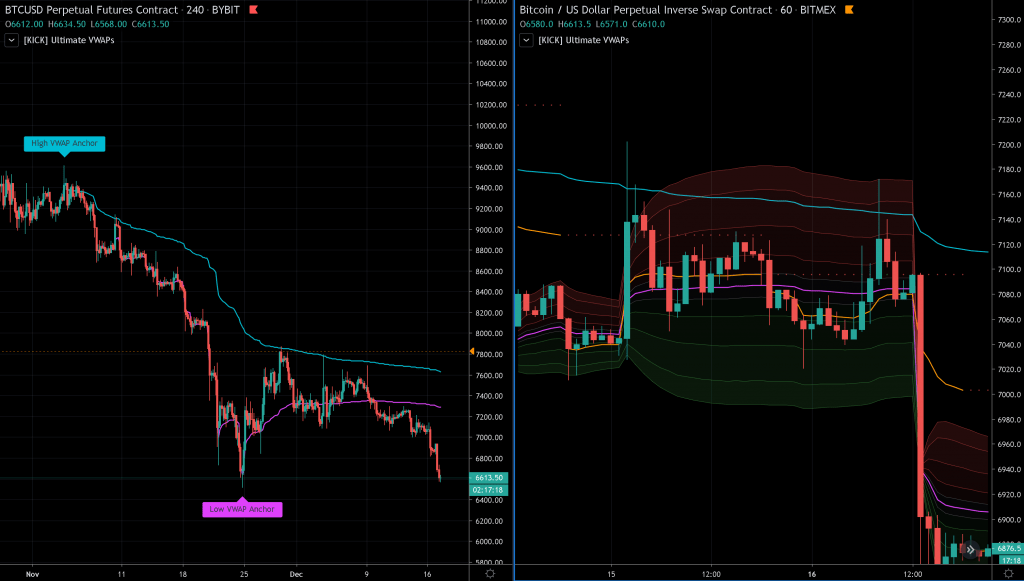
Ultimate VWAPs
TradingView Premium Indicator
- Enable a typical session-based VWAP (resets every session)
- Enable a week-to-date VWAP, month-to-date VWAP, or year-to-date VWAP
- Enable an anchored VWAP that can be automatically anchored to the high within the last week (timeframe independent) or a certain number of candles back, or set to a specific date and time.
- Enable an anchored VWAP that can be automatically anchored to the low within the last week (timeframe independent) or a certain number of candles back, or set to a specific date and time.
- The week/month/year-to-date VWAP can also be treated as an Ad-Hoc anchored VWAP and have it’s anchor set to an arbitrary date and time.
- A support/resistance line can be added in for the last session’s VWAP close
- Z-Score bands can be added (band values configurable) and attached to any of the above VWAPs (Session, AutoHigh, AutoLow, AdHoc/Week/Month/Year). These are calculated using the proper unbiased standard deviation calculation (not the built in PineScript biased stdev function)
- Request a trial for this indicator
- View a video of this indicator and suggested usages [coming soon]
- Purchase this indicator now!
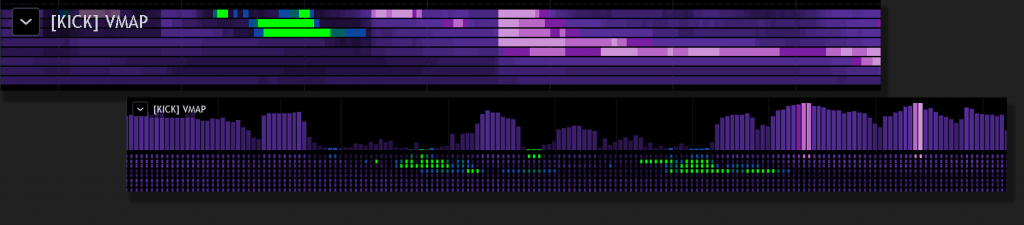
Volatility Heat Map
TradingView Premium Indicator
- Gauge the price volatility of an instrument across multiple timeframes
- Find critically low areas of volatility
- Predict the likelihood of an imminent move or the conclusion of a move
- Measure volatility using either Average True Range Percentile Rank (ATR-PR) or Historical Volatility Percentile (HVP)
- Measure volatility from any other source (e.g. Volume, or custom series from another indicator) using HVP
- Get alerts when a certain number of timeframe levels (configurable) are showing critically low volatility (implying imminent move)
- Get an alert when the current timeframe volatility level emerges from a critically low volatility zone (usually indicating the start of a significant move)
- 2 Rendering Modes (Smooth and Distinct)
- Ability to show current timeframe Volatility in bar chart above the heatmap
- Request a trial for this indicator
- View a video of this indicator and suggested usages [coming soon]
- Purchase this indicator now
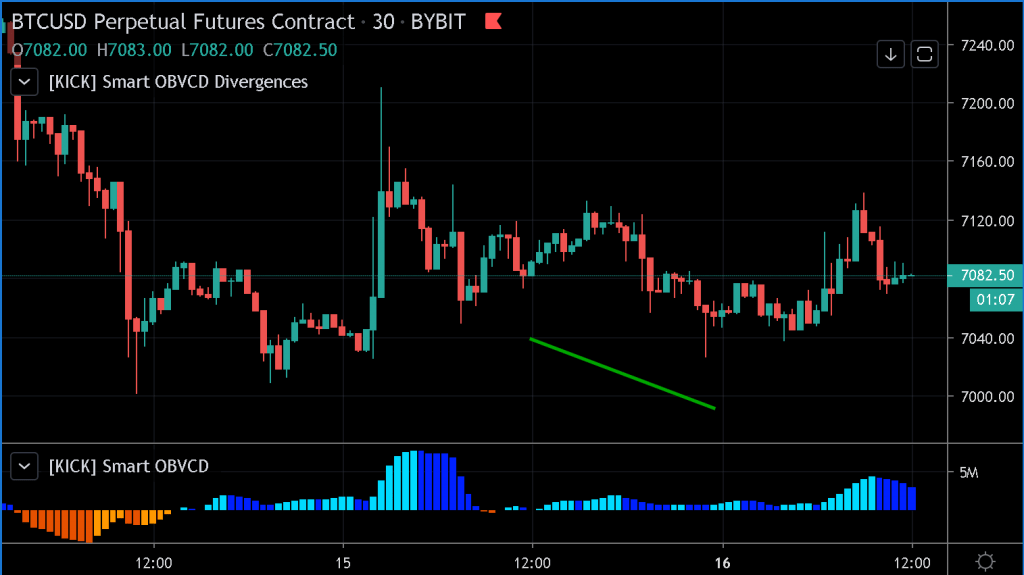
Smart OBVCD and Divergences
TradingView Premium Indicators
- Volume is segmented into buy or sell volume by analyzing smaller timeframes (down to 1 minute)
- The sell vs. buy volume is calculated as a running total (as per normal OBV calculations)
- The Convergence/Divergence of the OBV Buy and Sell volumes are smoothed with 3rd generation averaging methods
- The Smart OBVCD indicator visualizes the above calculation on a histogram to make it easier to see the values and how they relate to the price action.
- The Smart OBVCD Divergence indicator plots Regular and Hidden Bullish and Bearish divergence on higher timeframes based on the calculations and also provides early “warnings” for unconfirmed divergences forming (note: these are unconfirmed because the higher high or lower low have now yet been confirmed on the higher timeframe).
- Request a trial for this indicator
- View a video of this indicator and suggested usages [coming soon]
- Purchase this indicator now
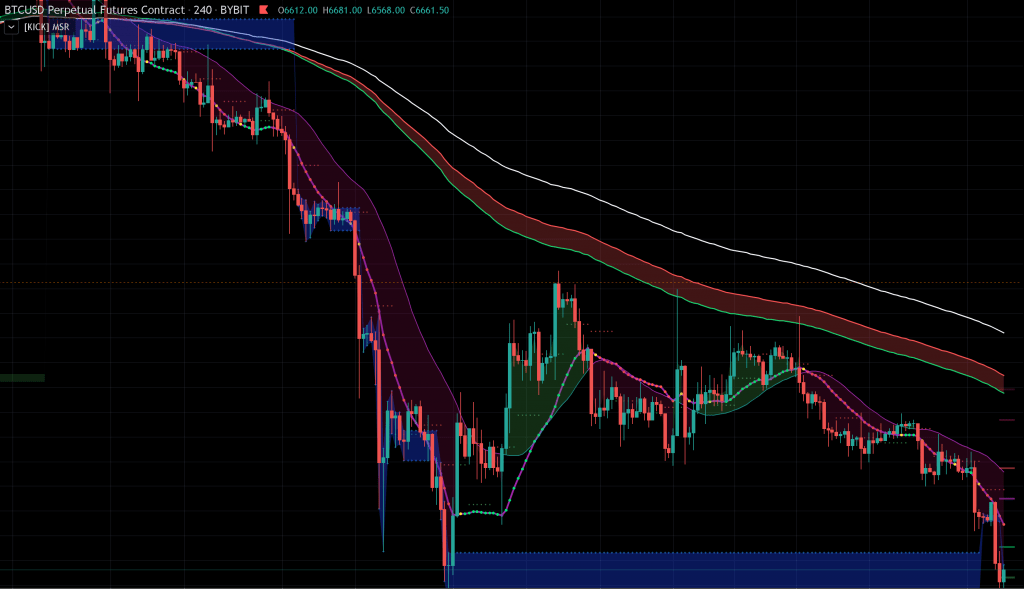
Mega Support/Resistance
TradingView Premium Indicator
- Up to 3 SMA/EMA’s on different timeframes than the current
- Fibonacci EMA’s (21, 55, 89, 200, note: 144 and 233 available in vegas wave below)
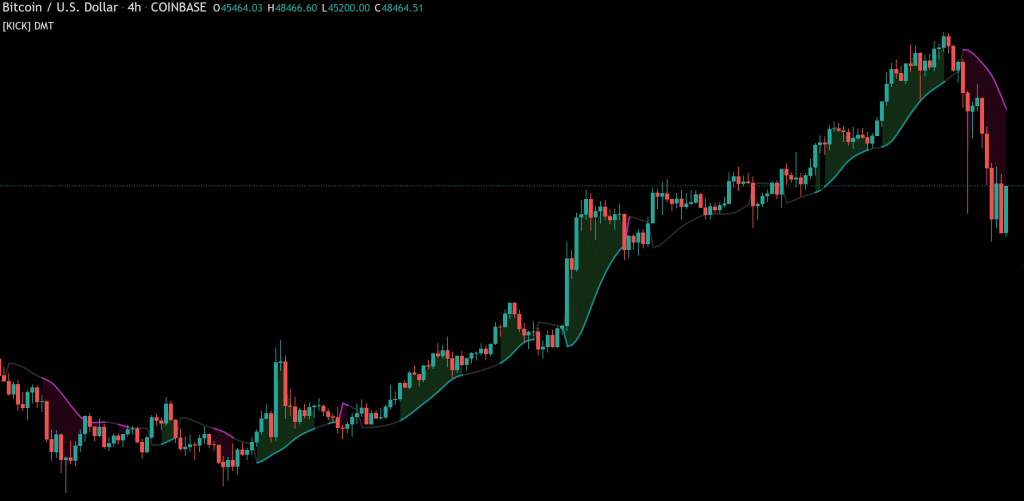
- Kickline (a special 3rd generation moving average based on the works of Dürschner). Enhanced to show and alert on bullish/bearish changes.
- Smoothed Median Moving Average w/ optional “shadow”
- Pivot Points (for any timeframe)
- Vegas Wave (144/169/233)
- VWAP (current session and previous session close S/R)
- Z-Score Bands assignable to Session VWAP or Smoothed Median Moving Average
- RSI-Based Supply/Demand Zones
- Request a trial for this indicator
- View a video of this indicator and suggested usages [coming soon]
- Purchase this indicator now
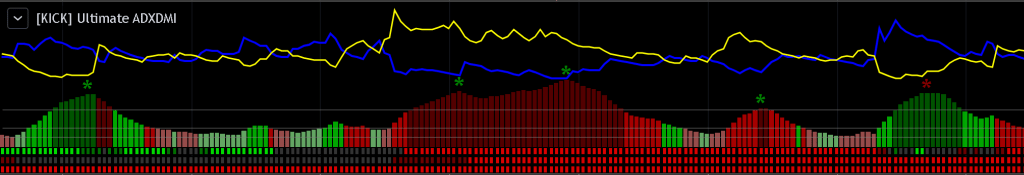
Ultimate ADXDMI
TradingView Premium Indicator
- Use the ADX barchart to determine strength of trend. There are various thresholds for this measurement as well as peak marking.
- Use the DMI line graphs (as well as the color codes on the ADX barchart) to determine trending direction. You can offset the DI+ and DI- lines so that they are not directly on top of the ADX chart.
- You can specify up to 3 additional timeframes to monitor in the dot map below the ADX chart that will give you a generalized idea of the trend on those larger timeframes.
- Request a trial for this indicator
- View a video of this indicator and suggested usages
- Purchase this indicator now
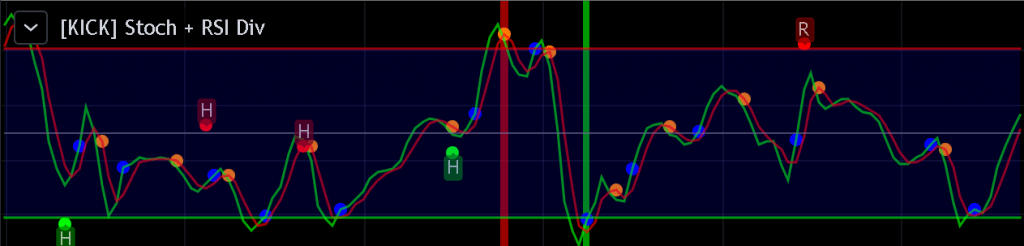
Full Stoch + RSI Div
TradingView FREE Indicator
- Stoch is fully configurable and allows for filtered (with a threshold) cross-over indications (dots). Optionally you can have it highlight crosses in the OB/OS zones.
- RSI divergence for both bullish and bearish and both types (regular and hidden). Note that these divergences will repaint and always show up 2 bars “late” so that the top or bottom can be confirmed.
- View a video of this indicator and suggested usages [coming soon]
- Register for free access to this indicator now (proceed through “purchase” of product for $0)
Dynamic Median Trender
Free TradingView Indicator
- View a video of this indicator and suggested usages [coming soon]
- Register for free access to this indicator now (proceed through “purchase” of product for $0)
Universal Divergence
TradingView FREE Indicator
This indicator is designed to be used with another oscillator indicator of your choice and basically adds universal support for regular and hidden divergence. It is not meant to be used on it’s own.
For an explanation for how to use see this YouTube video.
CryptoKick's Trading Tools
FREE TOOL!
- Calculating the details of trade setups for margin trading (specifically for Kraken/Bitfinex and Bitmex/Deribit/Bybit/Binance, but can be used with any margin/spot/futures exchange)
- Kelly Criterion Position Risk Sizing Calculator
- Note: previous functionality that required Excel macros to be enabled (to support updating data from webservices) has been removed.